
2017-2018 Workshop “Critical Making of Frictional Urban Interfaces”
Workshop Critical Making of Frictional Urban Interfaces
6-7 March 2018 | 10:00 18:00 | Parnassos, Kruisstraat 201, Utrecht
AIM
In this workshop, we shall work with urban data in order to explore the growing influence of data in our current urban societies, and raise questions about focussing on frictions. The pervasive presence of media technologies in, and datafication of urban space is connected with various urban frictions. Examples of these frictions include urban data giving rise to new processes of social sorting (think of crime maps), the further encroachment of commercial interests onto urban public space (e.g. customer loyalty cards, personalized marketing, tracking), and the militarization of urban space (e.g. surveillance, facial recognition, risk analysis).
We tend to think of frictions as problematic obstacles to be overcome or minimized. However, frictions can also be productive. Artists, designers, and academics have used these very frictions as starting points to make publicly visible and raise questions about the role we want technologies to play in our cities. In this workshop, we will use Friction as Central Design Principle.
For this, we aim to bring together the worlds of creative making and critical reflection, through an approach called ‘critical making’. Critical making is a term coined by Matt Ratto “to describe the combination of critical thinking with hands-on-making: a kind pedagogical practice that uses material engagements with technologies to open and extend critical social reflection” (Hertz).
ASSIGNMENT
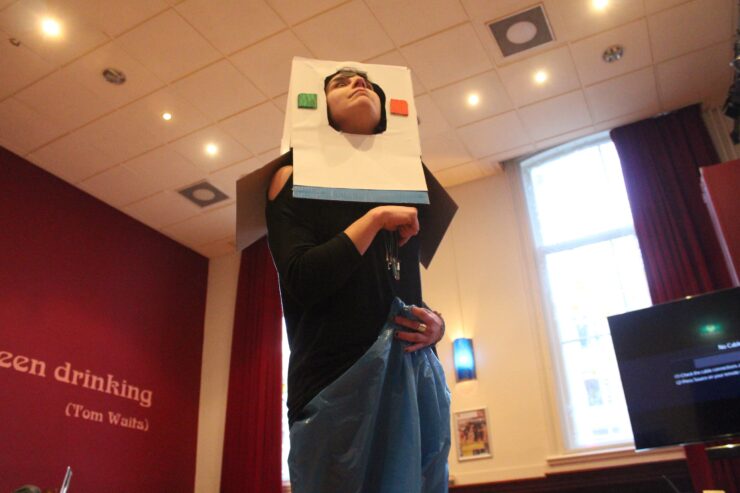
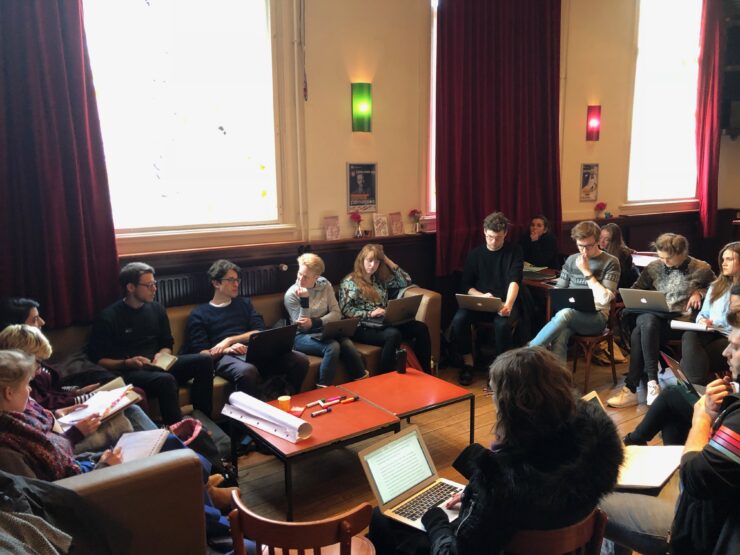
During this workshop, teams will develop a dramatized data interface for a public location, that explores and elucidates urban frictions in technologically mediated cities.
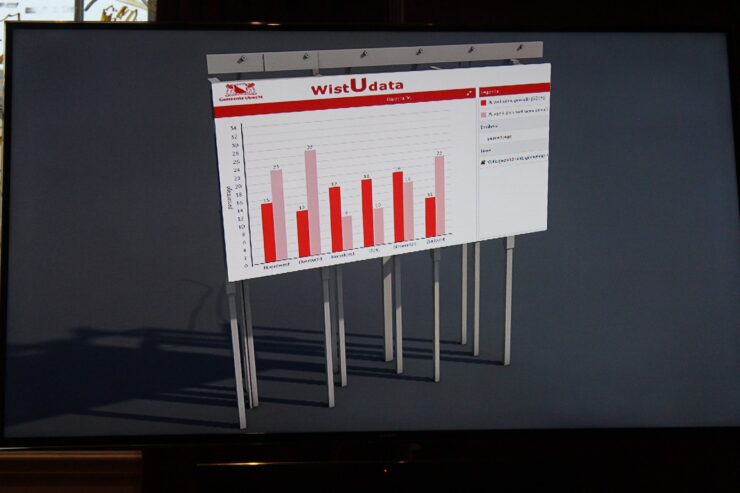
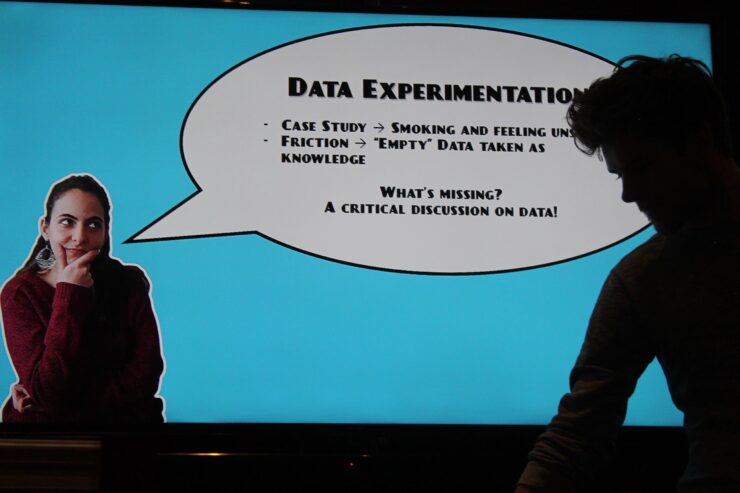
We understand datasets as frozen stories, snapshots that we can imaginatively reconstruct. Teams analyze a given dataset from https://utrecht.buurtmonitor.nl. Questions to consider: Who are the ‘characters’, the people who collected and selected these data? What aims did they have? What hangups, issues, emotions did they have producing this data? What frictions can you identify in the making of the data? What do the data say, what do they not speak about, what are the limitations and biases, what could be the embedded politics?
Output: This step is meant to get the creative juices flowing, and to begin the critical process. The outcome is a list of at least 3 initial intuitions about possible dramatizations of data, beyond its apparent intention. Sketch this on a poster for presentation.
Step 2 – Urban friction as plotting device
We consider friction as a way to bring drama into the reconstruction of the dataset. Teams formulate at least five possible frictions arising from step 1. Next, teams identify one specific friction that you will work with. The aim is to change the way we think of data as saying something about the world. Output: a defined urban friction to work with, that acts as a plotting mechanism. Sketch this on a poster for presentation.
Step 3 – Situating the urban friction
In his step you will develop the narrative setting of the friction. Each team will determine a location and time that situates, and offers the context of this friction. Where and when does the story take place?
Output: storyboard for a dramatized narrative in a particular urban setting.
Step 4 – Urban interface
From the dramatization of data developed in step 1-3, we now move to the design of a critical interface. How can your interface mediate the frictions imagined in the dataset, and how can people engage with this? Briefly review the existing visual aesthetics of datavisualization on urban dashboards. Think not only about what interfaces represent but also about how they produce, ‘perform’ a specific type of narrative. How can you subvert this logics and aesthetics? How can you make friction a guiding design principle for datavis and dashboards? How can your interface produce certain meanings and affects in people?
Output: a mockup or sketch of a tangible, material interface.
Step 5 – Urban Intervention
In the final step you locate this interface in the urban context. Re-connect the dramatized data (steps 1-3) and the interface (step 4) to the city: Where and when will you place your story as a localized urban intervention? How can you engage an audience with your story? How is this a way of making your data narrative truly “public”?
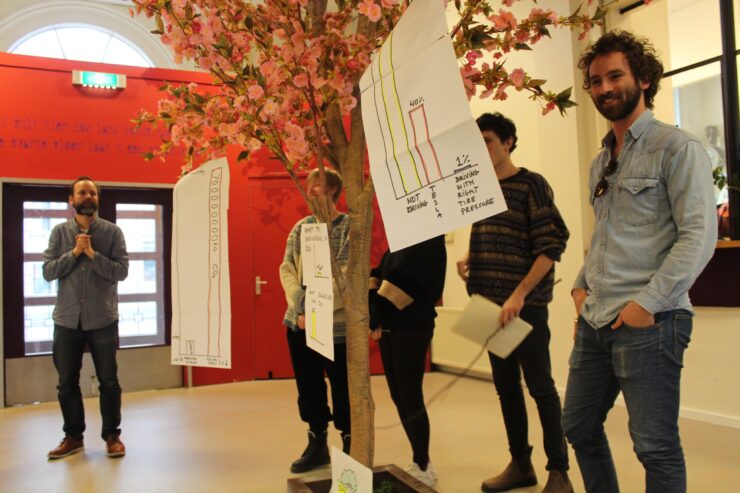
Output: present your design in the form of your choosing – including a statement about the critical aim of this intervention.
10:00 Welcome to “Workshop Critical Making of Frictional Urban Interfaces” by Nanna Verhoeff, Michiel de Lange, Sigrid Merx, Hira Sheikh 10:20 Introduction to Critical Making by Klaas Kuitenbrouwer 10:40 Introduction by Fabian van Sluijs (Creative Coding Utrecht) 10:45 Ruben van de Ven (Affective Interfaces) 11:05 Daan Krijnen (Ngage Media – interactive urban screens) 11:15 Cristina Cochior (Data Dramatization) 11:40 Formation of teams; Introduction by participants 12:00 Lunch 13:00 STEP 1 14:30 STEP 2 16:00 STEP 3 17:00 Team present their work in progress 18:00 Close Day 2 – 7th March 2018 10:00 STEP 4 13:00 Lunch 14:00 STEP 5 16:00 Finalization, preparing for the presentation 16:30 Presentations 18:00 Drinks!