
[urban interfaces] Blogs
Digital Cartography: From Mapping Places To Mapping Society
This blogpost is a result of the graduate seminar “Interfacing the (In)formal City” 2021.
Written by Andre Joglekar.
Digital Cartography: From Mapping Places To Mapping Society
Cartography has had an essential role in contemporary communication. The spread of GPS (Global Positioning System) in mobile phones, interactive mapping tools and social networks through the internet have fuelled the development of the field. The objective role of traditional maps in a phase of decline. Nowadays there are forms of interactive communication that have the potential of broadening points of views by relating together different themes and sharing more information than ever before. Recent development of technological tools have not only been able to sustain the demand for maps, but also modified the descriptive capacity of traditional maps. There has been a disciplinary redefinition of traditional maps, coined “multimedia cartography” by William Cartwright and Michael P. Peterson. This term suggests that the role of the map has been redefined beyond mere geospatial information. The changes are not just in the way the maps look, but in types of audiences that look at the maps and the way audiences interacts with data. Cartography has become a tool for politics, businesses, government entities, administration and many more. Multimedia maps have broadened the types of information that can be conveyed, becoming an efficient method to divulge visualisation of data coming from the most disparate sources. Digital maps allow for more ways of data visualisations. Some examples include data visualisations of pollution in a city, the number of Instagram photos taken by tourists or locals in a city, sensors that measure temperature at the ocean floor or a more recent example of remapping the city during the coronavirus pandemic lockdown period. Accordingly the main question I raise is to what extent has technology shaped contemporary maps?
The use of software and digital tools for the creation of maps don’t exclude more traditional techniques of cartographic communication. Newer technologies are adapted to the traditional ones creating a synergy without the new eliminating the older. For example the use of symbols for position, chromatic scales for different data, scales, border lines, legends and units of measure are all devices from the past that are taken in consideration when designing a map.
What new technologies have changed in the production of maps is the computerisation of the medium, and the increased opportunity for distribution and accessibility.
Currently, the internet allows for easier and quicker access to databases in order to source information for designing a map. Moreover, from being traditional medium to symbolically represent information of geographical spaces, maps have entered the category of tools to present any type of information accessible to everyone.
The audience appears to be free to chose what information to absorb and takes the active role of the protagonist. While paper maps served to navigate and explore geographical spaces, cybermaps will guide us through the array of information we are exposed to doing the digital era. Navigating the cyberspace and the internet have become for a significant part of the world populations, a daily experience, very close to watching television, cinema or reading a magazine/ newspaper.
Not limited by a paper based format, maps have become instantly accessible, updatable and sharable. Interconnection and immateriality have become the new features of maps. The speed of the continuous evolution of this mediums has nonetheless some limitations. Information needs to be constantly updated, further, the amount of information available creates the risk of compromising the quality and acquisition of the data. Another limitation proposed by Dana Cuff is that “Maps are never “true” or “singular” images, and the mapmaker is always implicated in the contingent process of mapping.” (Cuff, 2020)
Hence, maps are not neutral and as the author suggest, maps have become so omnipresent in daily life that they appear “somehow objective systems, free of ideology, strictly utilitarian, and open to everyone.” (Cuff, 2020)
Further, Huybrechts et al. suggest another complication in the process of designing maps. The issue raised is that while creating maps designers are limited by local geographical spaces whilst addressing issues of bigger, global scope. Huybrechts et al. state that: “Therefore, the problem is how to connect and confront the local dimension with wider, societal, themes.” (Huybrechts et al. 2020) Digitally produced maps, such as the one in Figure 1, demonstrate how the problem can be tackled by visually addressing a local problem and sharing it with the global community.
Figure 1 shows a digital map of Calais, France designed by cartographer Arthur Beaubois-Jude during the lockdown period of the Covid-19 pandemic. The map represents the perimeter of the authorised living perimeter and places of the interest of the designer during the lockdown.
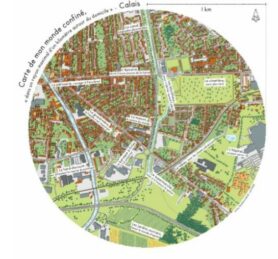
Figure 1
Arthur Beaubois-Jude (2020)
https://www.bloomberg.com/features/ 2020-coronavirus-lockdown-neighborhood-maps/
The map does not merely represent geographical areas, but relates to bigger issues faced by the entire population worldwide. Thus, the map symbolised a local problem that resonates at a global level. Similarly, other cartographers and designer have produced digital maps, with their own artistic agenda, but showcasing a similar problem in their own city. The collection of these maps is part of a bigger frameworks that suggest how during the lockdown every person’s world had to be remapped. The maps open window into the experiences and social limitations of people not just locally but at a global level.
In conclusion it is not easy to predict the future of cartography and the possible lines of development. What seems evident is that cybermaps are moving towards frameworks that convey every type of data or concept in the most immediate fluid and dynamic way possible. Maps have become tools to facilitate social and political action. The challenges seem to be posed only by technology. The limits lay in how far digital devices can select reliable data and process it so that the map speaks back to audience.
Cartography has the potential to become an important feature in the daily personal tools of people. In a world where everything and everyone is more connected, the day digital cartography will suggest not only the nearest parking but the at the exact time we want it, doesn’t seem far. Digital maps generate new methods for presenting reality, and provide the framework to identify even something that might have been previously neglected by the human eye.
Bibliography:
Cartwright, William. Peterson P. Michael. “Multimedia Cartography.” in Multimedia Cartography, Springer, Berlin, Heidelberg, (2007): 1-10
https://doi-org.proxy.library.uu.nl/10.1007/978-3-540-36651-5_1
Cuff, Dana, Anastasia Loukaitou-Sideris, Todd Samuel Presner, Maite Zubiaurre, and Jonathan Crisman. 2020. Urban Humanities: New Practices for Reimagining the City. Cambridge, MA: The MIT Press. Chapter 3 “Fused Scholarship: Practices of Urban Humanities.”
Huybrechts, Liesbeth, Maurizio Teli, Mela Zuljevic & Mela Bettega. 2020. “Visions that Change. Articulating the Politics of Participatory Design”, CoDesign, 16:1, 3-16 (+ editorial from the special issue on participatory design the journal CoDesign: